Why Productivity Metrics Break When Agents Write the Code

In short
Developer productivity metrics count what engineers produce: lines, commits, pull requests, story points. When agents write the code, production rises by multiples while the number of releases rises by a fifth. The measures that still hold are taken at the end of the chain: lead time to an accepted release, change failure and rework, human attention per accepted change, and the time from generated output to accountable acceptance.
One dataset, six metrics, one direction
Demirer, Musolff and Yang matched more than 500,000 GitHub developers to AI usage telemetry and followed what happened after each generation of tool was adopted: autocomplete, then interactive agents working inside the developer's session, then autonomous agents working on their own (NBER Working Paper 35275, revised September 2026).
The worked example is their Table 6, which reports, for weeks twenty-one to thirty after adoption, the change in six metrics relative to a matched control developer, as a percentage of each developer's own pre-adoption mean. After adopting interactive agents, lines changed, added plus deleted, rose 957.5 percent, files touched 265.0 percent, commits 153.2 percent, pull requests 86.0 percent, repositories touched 47.3 percent, and releases 19.8 percent. The authors put the row in one sentence: "Sync agents raise lines of code by 958% and pull requests by 86%, but releases by only 20%."
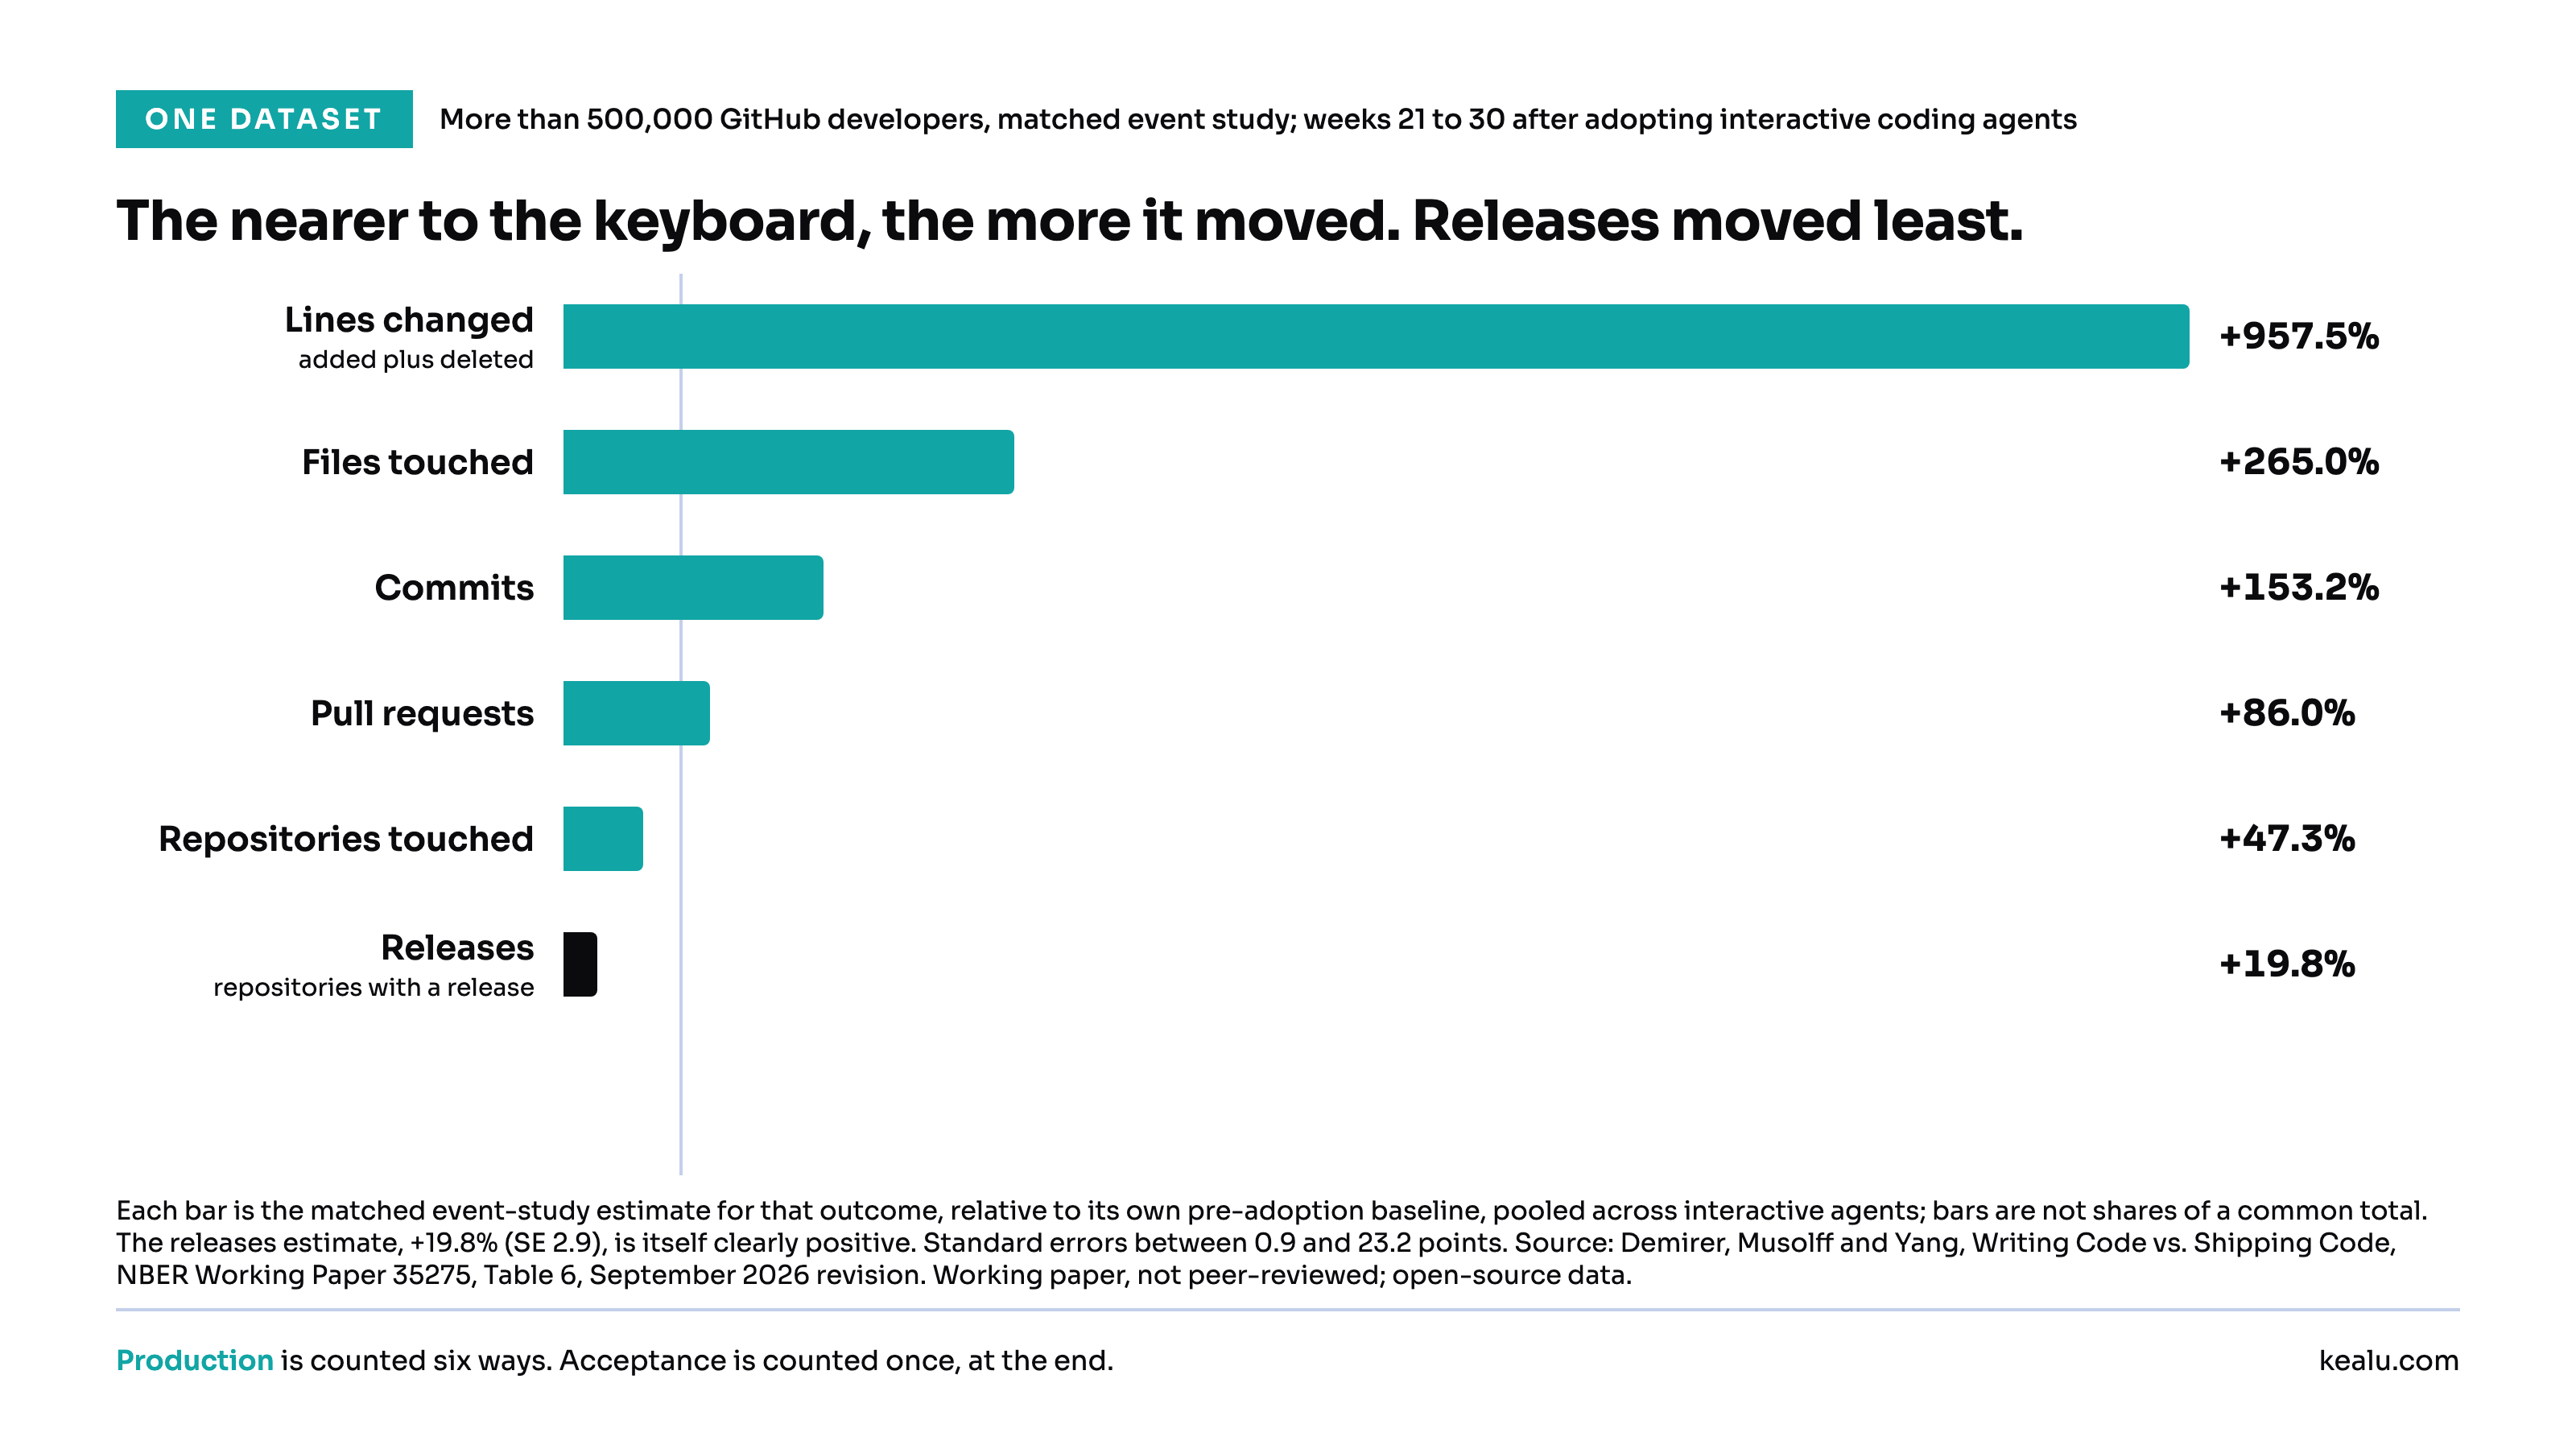
The same data show where the difference goes. "After adopting sync agents, developers add 7.0 times as many lines of code but delete 12.2 times as many, so more of what they write is rewritten or discarded. They create 79% more branches, exploring features that are often later abandoned." The authors explain the attenuation through the stages that follow writing: "code review, quality control, and release capacity limit how much of the additional early-stage output advances to the later stages, where human input remains essential." Their conclusion: "In software, the binding constraint appears to be shifting from writing code to reviewing, integrating, and distributing it."
Three limits apply, each stated by the authors. The data "cover only open-source software and four major software marketplaces" with "little coverage of enterprise software". The analysis "relies on observational data, which raises concerns about identifying a causal effect." And releases "are not reported for async tools because releases are measured at the repository level and cannot be split into agent- and human-authored components", so nothing in the table says what autonomous agents do to shipping.
What the delivery metrics say
DORA's annual survey measures the end of the chain, with keys such as "Change lead time: the time it takes for a code commit or change to be successfully deployed to production" and "Change fail rate: the percentage of deployments that cause failures in production, requiring hotfixes or rollbacks" (Accelerate State of DevOps Report 2024). On nearly 3,000 respondents, the 2024 report found individual gains and a delivery loss in the same data: "Productivity, for example, is likely to increase by approximately 2.1% when an individual's AI adoption is increased by 25%", and then: "Contrary to our expectations, our findings indicate that AI adoption is negatively impacting software delivery performance. We see that the effect on delivery throughput is small, but likely negative (an estimated 1.5% reduction for every 25% increase in AI adoption). The negative impact on delivery stability is larger (an estimated 7.2% reduction for every 25% increase in AI adoption)."
The 2025 report, on nearly 5,000 respondents, reverses one sign and keeps the other: "AI adoption now improves software delivery throughput, a key shift from last year. However, it still increases delivery instability." (State of AI-assisted Software Development 2025) It raises a stronger possibility about its own capabilities and measurements: "These technical capabilities and measurements no longer suffice. They must evolve for the AI era, be replaced, or be supplemented."
Where the time goes
One company measured what happens when the production metric becomes the target. He, Agarwal and colleagues followed 802 developers and 196,212 pull requests at a mid-sized software company whose technology chief set "merged PRs per engineer per month as the progress metric" and asked for a doubling (arXiv, July 2026). The target was met: per-capita throughput reached 2.09 times the pre-mandate baseline in April 2026. Review did not keep up. "The share of PRs receiving at least one human review fell 21 percentage points (89% to 68%)", and the substantive part of human review, "reviews with a human-written comment", fell from about 39 to about 21 percent of pull requests "while silent approvals held roughly flat". The authors note that adoption and usage intensity "were not randomly assigned".
Marilyn Strathern described the pattern in 1997: "When a measure becomes a target, it ceases to be a good measure." (European Review, 1997) Merged pull requests per engineer was a proxy for progress while people wrote the pull requests; once a growing share was produced with agents, the count measured that output together with human approvals that were increasingly silent. The authors link the bulk of the within-developer gain to adoption and accumulated use, and note that merge and revert rates held steady.
The measures that still hold
Our white paper AI Has Moved the Bottleneck states the misreading in one line: "If the visible output of engineering is code, more code appears to indicate more progress." Its correction follows: "Code is an intermediate representation in this chain." The paper then lists measures it says are also needed, five of its seven being: "human attention per accepted change", "time from generated output to accountable acceptance", "rework caused by hidden assumptions", "evidence completeness and freshness", and "defects or incidents attributable to agent-generated work".
Two of those already exist in DORA's vocabulary: lead time, from commit to production, is time to acceptance under another name, and change failure rate and rework rate are the cost of accepting work before it was ready. The other three are new work for most teams: how much of a reviewer's day each merged change consumed; how much of what was written was deleted again; and whether each accepted change carried what the review checklist for agent-written changes asks for, with its assurance case complete at release.
The SPACE framework gives the rule of construction: "if you are already measuring commits (an activity measure), don't simply add the number of pull requests and coding time to your metrics dashboard, as these are both activity metrics" (ACM Queue, 2021). A production metric for context, an acceptance metric for the decision and a stability metric for the consequence give a dashboard in which faster typing moves only the first number. Our article on agentic engineering describes the two capacities those metrics measure.
Where Kealu Vector fits
The Agentic Engineering Assurance Layer is the proposed category for the layer that governs how agentic engineering work is performed and evidenced, so that humans can trust and accept the resulting work. The white paper The Agentic Engineering Assurance Layer develops it as a vendor-neutral category, and the questions raised here hold whatever tools a team uses to answer them. Kealu Vector, currently designated Vector Assurance Assist, is our early-access implementation of that category.
FAQ
Why do developer productivity metrics break when agents write the code?
Because they count production, and agents make production cheap. In a study of more than 500,000 GitHub developers, those who adopted interactive coding agents changed 957.5 percent more lines and opened 86.0 percent more pull requests, while releases rose 19.8 percent. A metric taken before the release reports a gain the release does not confirm.
Is developer velocity a good metric for teams using AI coding agents?
Velocity counts work completed per period, and it moves with the production side of the pipeline. Kept alongside lead time to an accepted release and change failure rate it stays useful as context; on its own it counts output that has not yet been accepted.
What should teams measure instead of lines of code and commits?
The end of the chain: lead time from commit to an accepted, deployed change; change failure rate and rework rate; and, for agent-produced work, human attention per accepted change, time from generated output to accountable acceptance, and defects attributable to agent-generated changes. The SPACE framework's rule is never to stack activity metrics on each other.
Do AI coding agents increase software delivery throughput?
The evidence is mixed by year and by level. On GitHub, commits rose by multiples and releases by a fifth. DORA's 2024 survey estimated a small negative association between AI adoption and delivery throughput and its 2025 survey a positive one, with the association with instability holding in both years.
On Google
Add Kealu as a preferred source: our articles get highlighted in Top Stories, AI Mode and AI Overviews.
Talk to our team.
Questions about this article, or about using Kealu Vector in your organization? Send us a message.